deformatory
A game for three plus a mastermind "artist":
A team of three sits at a table outfitted with one simple controller for each person to manipulate. Another person is given a drawing tablet. That person sets the parameters for the game by drawing a shape. This shape is then converted into a sound, probably by providing the data for a table look-up. The team hears this target sound briefly, and then must use their controllers to output a tone that matches the sound the drawn waveform has become. The controllers each affect one of several parameters that define a sound (e.g. frequency, amplitude, Q value, phase). Each of these parameters is controlled by a different team member.
As the team manipulates their output sound, they see a visual representation
of the
sound they're currently producing. Once the team achieves a sound close
enough to their target sound (or the team gives up), the team's score
is determined by how close their sound was to the target sound. Difficulty
is variable, depending on how many of the parameters are put in play and
how wide the range of sounds the team could produce is.
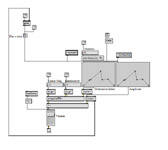
The projector, tablet, and knobs are all connected to the computer, which runs several tasks at a time:
CONCEPTS
Assigning control of one sound to several participants makes the game more difficult; simple activities that are intuitively achieved by one person become far more complicated when done by two or more people. For example, walking by oneself is much easier than a three-legged race. Similarly, if two different people had control of one's left and right arms, clapping would get quite cumbersome. The process of discovering how different team members actions affect the sound is fundamental to the project. Making more than one person responsible for creating a sound requires teamwork as well as interaction with the technology and among the team members. The piece is envisioned as an installation that would play out differently every time and would be interesting to the "players" and "audience" alike.
This project also shows how image and sound data are related. There are any number of image and sound analysis techniques (Fourier being the most famous). We used matrix analysis of unique colors to distill the data from the image into data that could be read by Max and represented as a sound file.
BUDGET AND SCHEDULE
| Item | Cost (USD) |
| iMac G5* | 1300 |
| Wacom 4"x5" Tablet | 85 |
| Max/MSP and Jitter software | 450 |
| Toshiba SVGA Digital Projector* | 850 |
| Desk, knobs, wiring | 200 |
| Subtotal | 2885 |
| Construction labor (estimate) | 1000 |
| Programming labor (estimate) | 3000 |
| Total | 6885 |
| Task | Time (days) |
| Obtain equipment | 7-10 |
| Programming | 7 |
| Construction | 2 |
| Total | 16-19 |
*For even more cost-cutting, one can use existing equipment: any computer that can run multiple patches of Max/MSP and Jitter will do. A high-grade projector is not required: 800 x 600 resolution is sufficient.
REFERENCES
Max/MSP
Jitter
Max/MSP and Jitter tutorials
A guide to Teleo and Cycling 74's Max/MSP
MSP FAQ
Taking the waveform apart: Spectral analysis
Fourier Analysis and Synthesis
Synaesthesia Wikipedia entry
The physics of sound waves
Fourier analysis with pixels
Dynamic Image Analysis of a Matrix of Scanned Points
| Angus Forbes | : | Jitter Visualizations/Programming |
| Eileen Koven | : | Research and Website |
| Daniel Mintz | : | MAX/MSP Programming |


